UI + Web Development
Published website
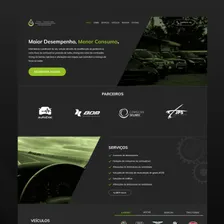
Fuel Injection Technology
A website redesign for a vehicle remapping business, focused on services and the booking journey.
- UI Design
- Prototyping
- Web Development

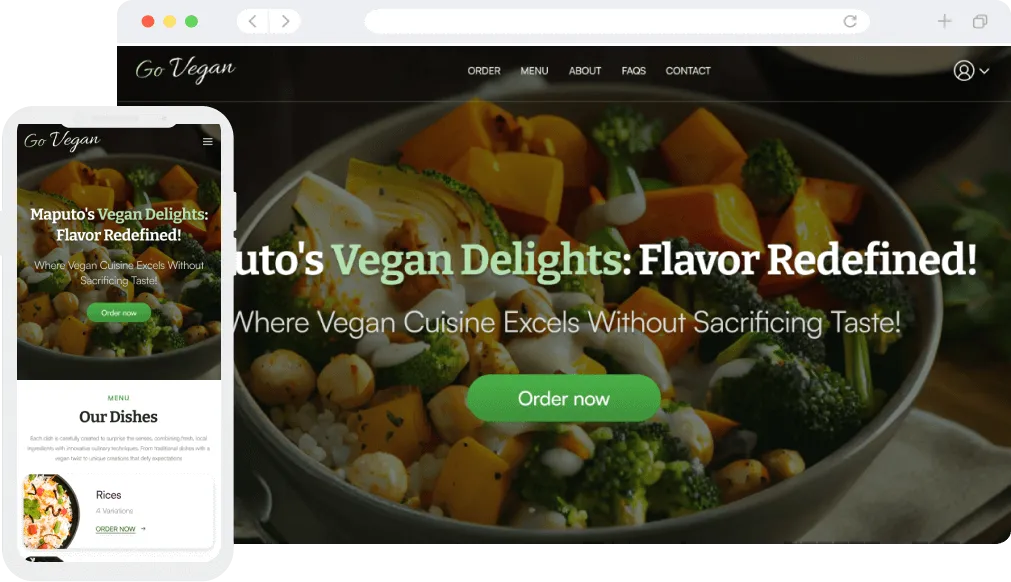
A website for a vegan restaurant that allows customers to order food delivery in Maputo.
The project at a glance
A personal project connecting research, interaction design and frontend implementation for a fictional vegan restaurant in Maputo.
Make it easier to choose dishes, understand portion sizes and review a customised food order.
A client-side demo with local menu data and simulated account and payment steps. The research explores a fictional restaurant.
Go Vegan Restaurantserves delicious and healthy plant-based food without compromising on taste or satisfaction, aiming to inspire and delight guests towards vegan diets.
After receiving information about customer (stakeholder) needs, resource requirements, and content requirements for certification, I was able to conduct interviews with four vegan diet enthusiasts.
The aim was to understand their interest in ordering vegan food and identify their main frustrations with food delivery services.
I would love to be able to order vegan food online with ease and convenience. Sometimes practicality is key for me.
Anita CarlosIt would be important for me to have a direct communication channel with the restaurant, in case something goes wrong with my order or if I have any suggestions to improve the service.
Tânia SitoeThe ability to track my order in real time gives me peace of mind. I like knowing when my food will arrive.
Lourenço BilaI then conducted a comprehensive survey and managed to obtain a total of 15 meaningful responses. The active participation of the interviewees allowed me to collect valuable insights and crucial data that will contribute to the development of the project.
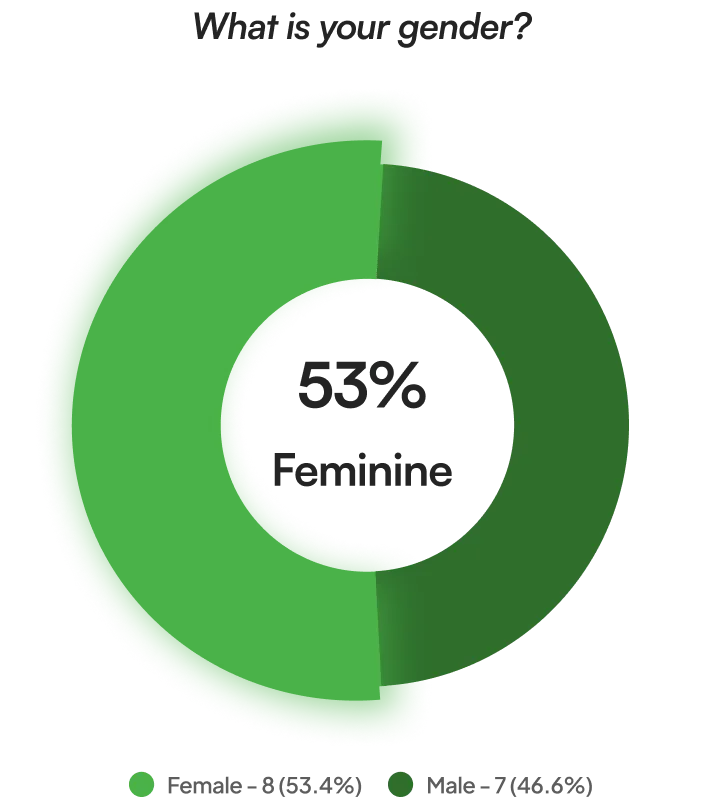
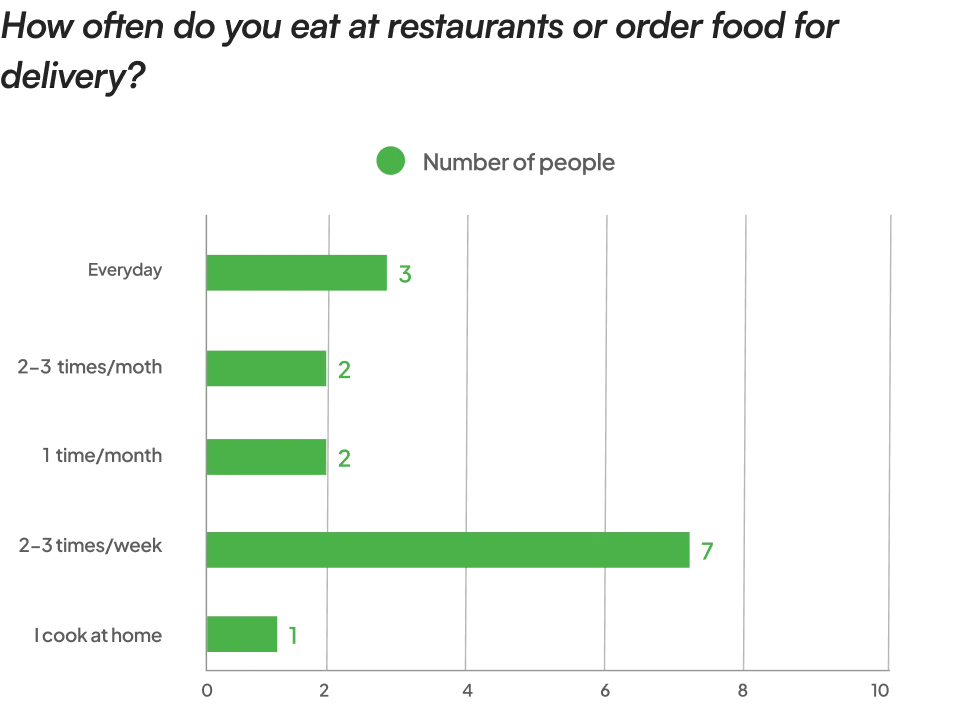
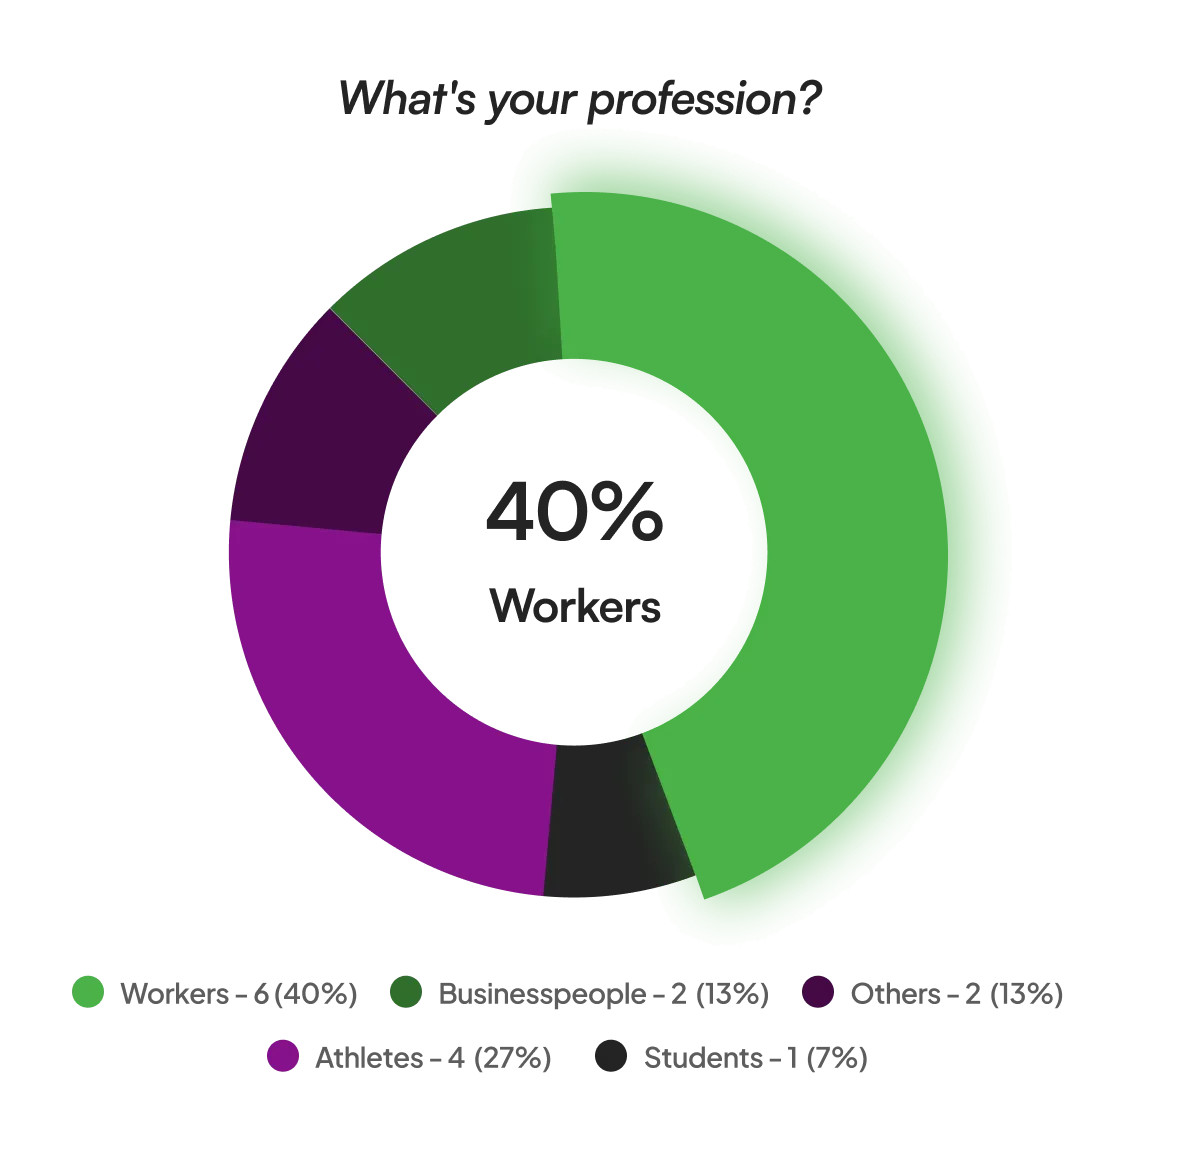
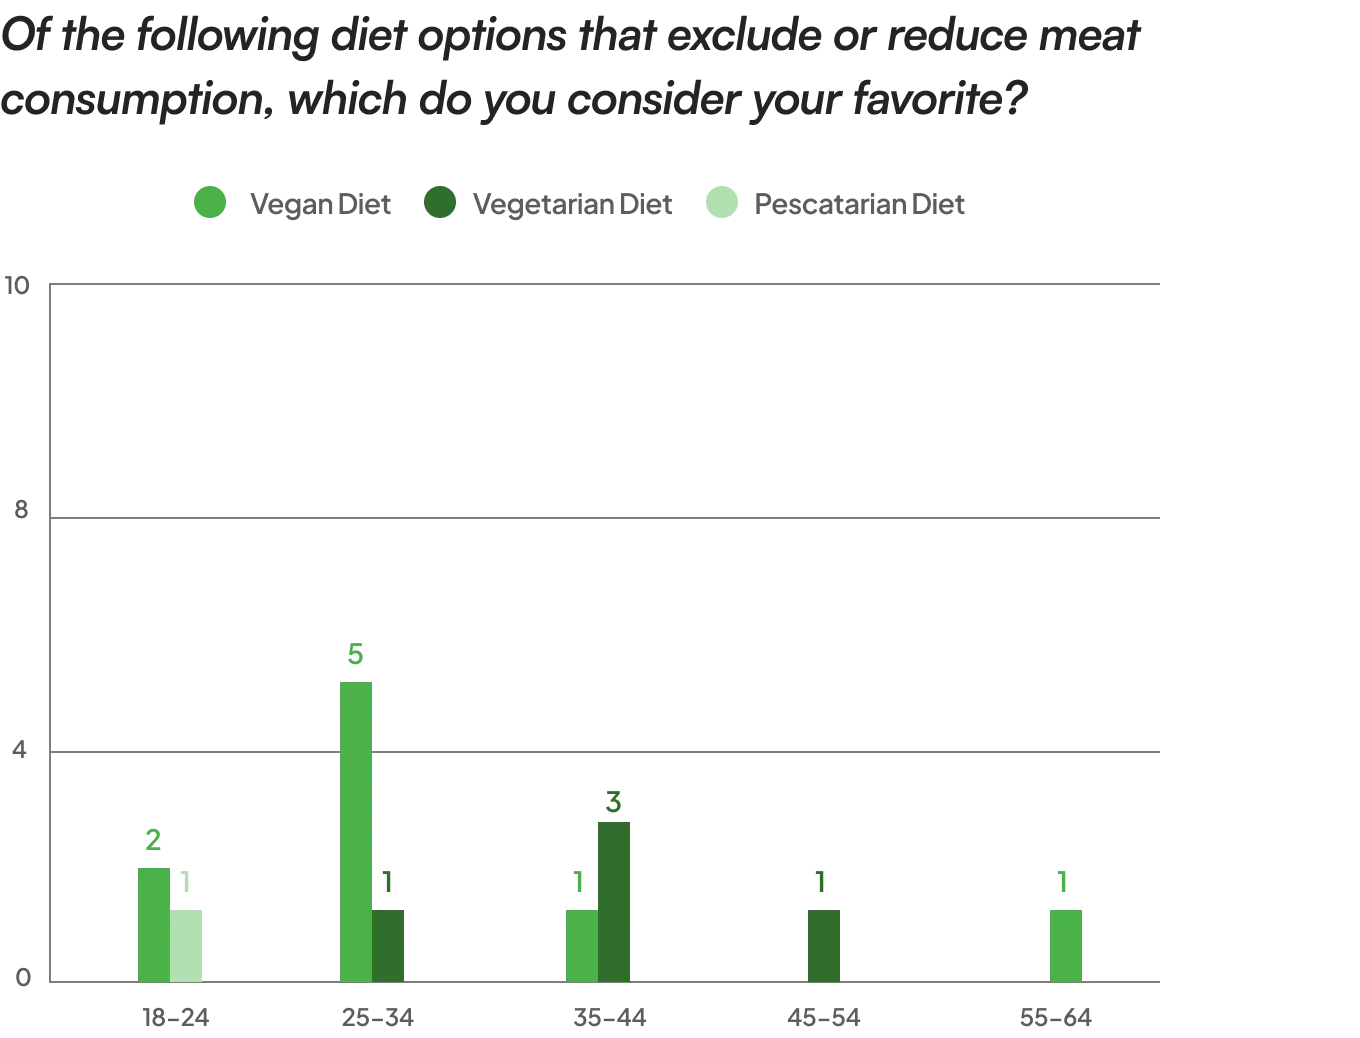
After the comprehensive research phase, I developed a representative user persona. Based on the knowledge gained about the target audience, their goals and needs, the user persona was created to encapsulate the main audience segments. This approach allows for precise focus on solving the most significant problems, addressing the essential needs of the user groups most relevant to the project
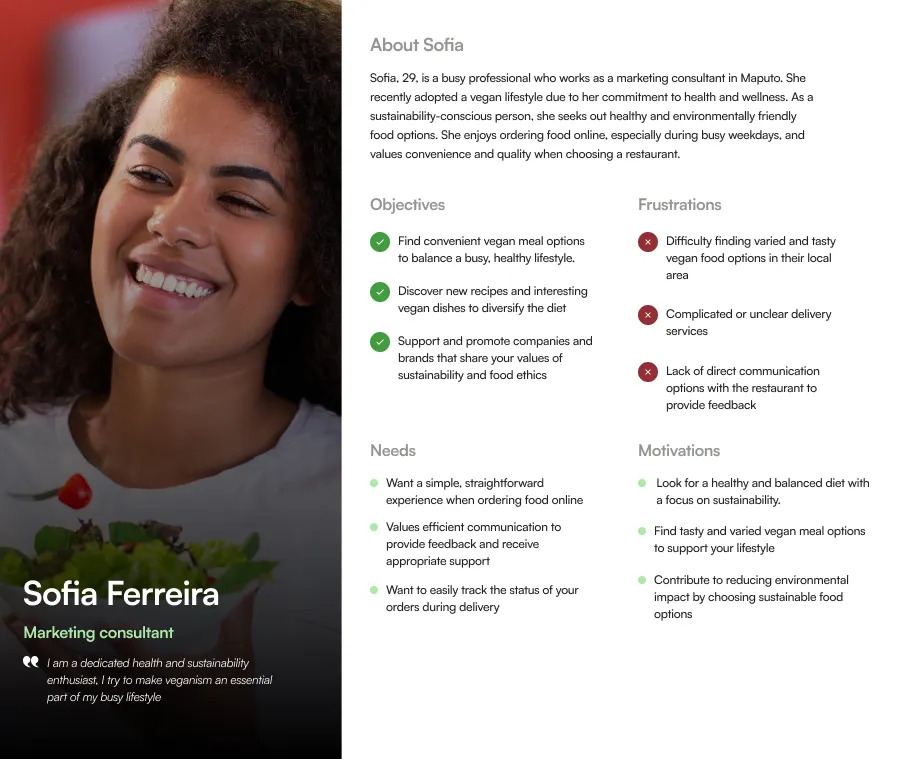
To define the problem I needed to solve, I created point of view (POV) statements that allowed me to ideate in a targeted way with clear goals and How Might We questions to guide me through the ideation process. These statements and questions were generated based on the knowledge and needs I identified during the research phase.
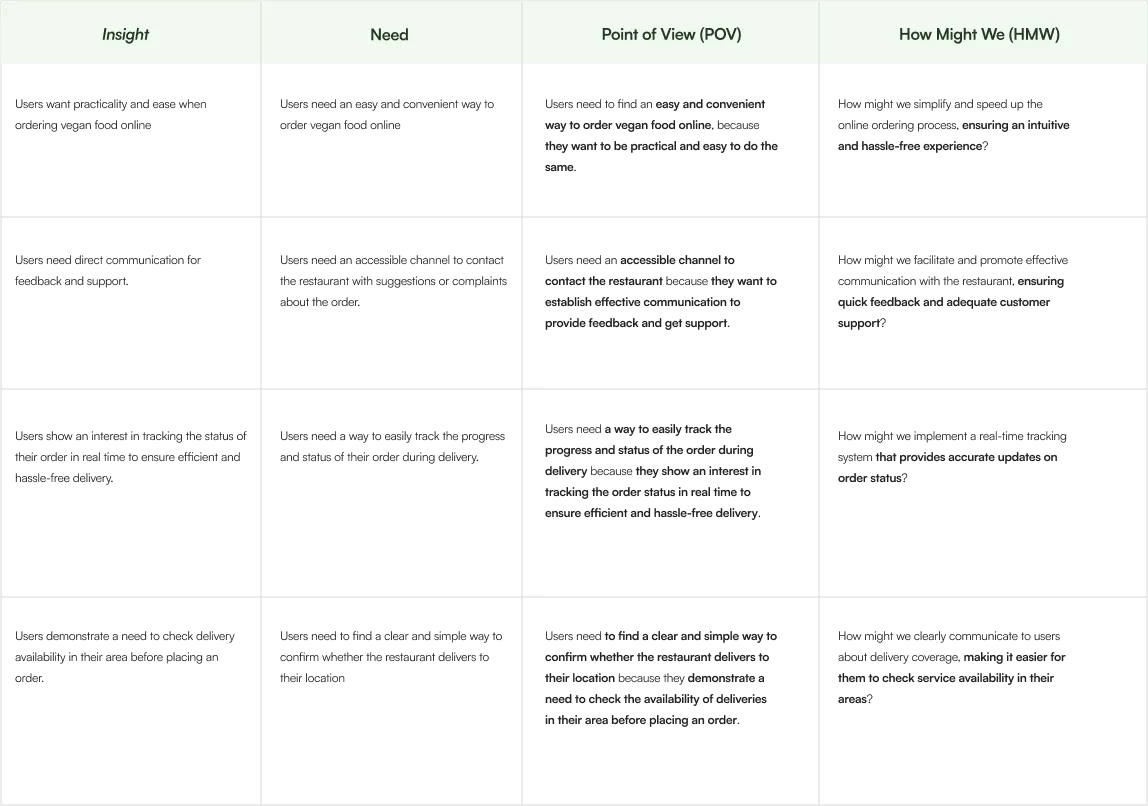
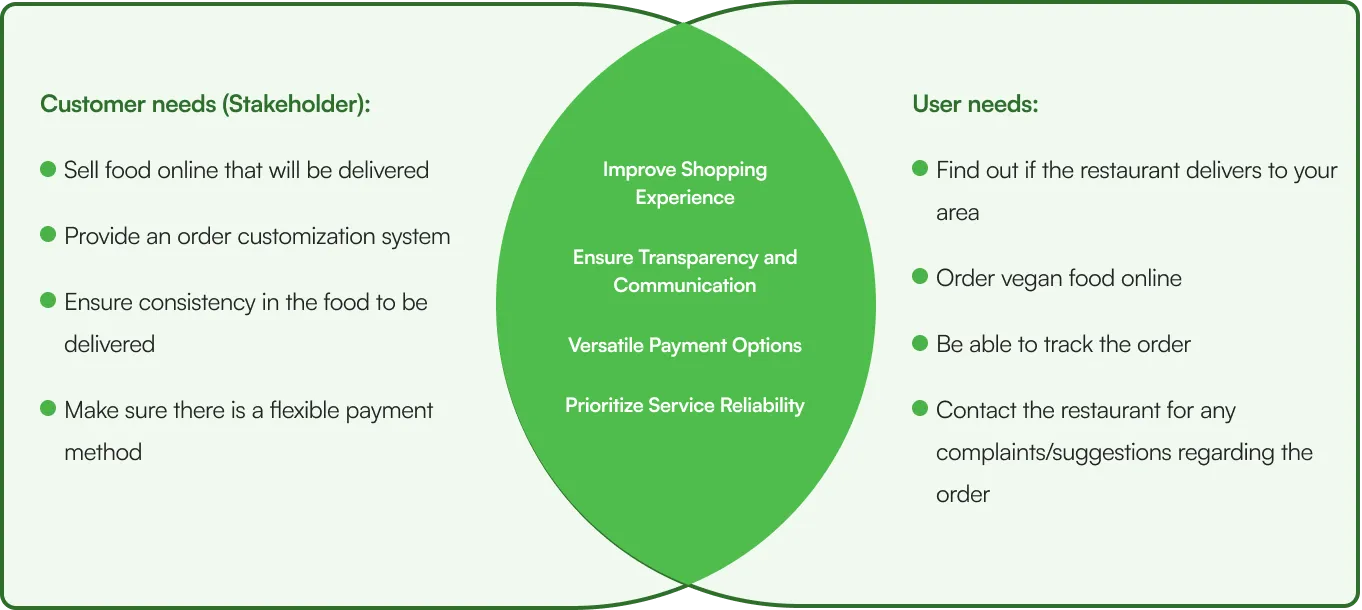
After creating viewpoint statements and formulating the 'How Might We' questions, I conducted brainstorming sessions for each question. Based on the ideas generated, I compiled a list of key project objectives, which will play a key role in guiding decisions about which features to include on the site.
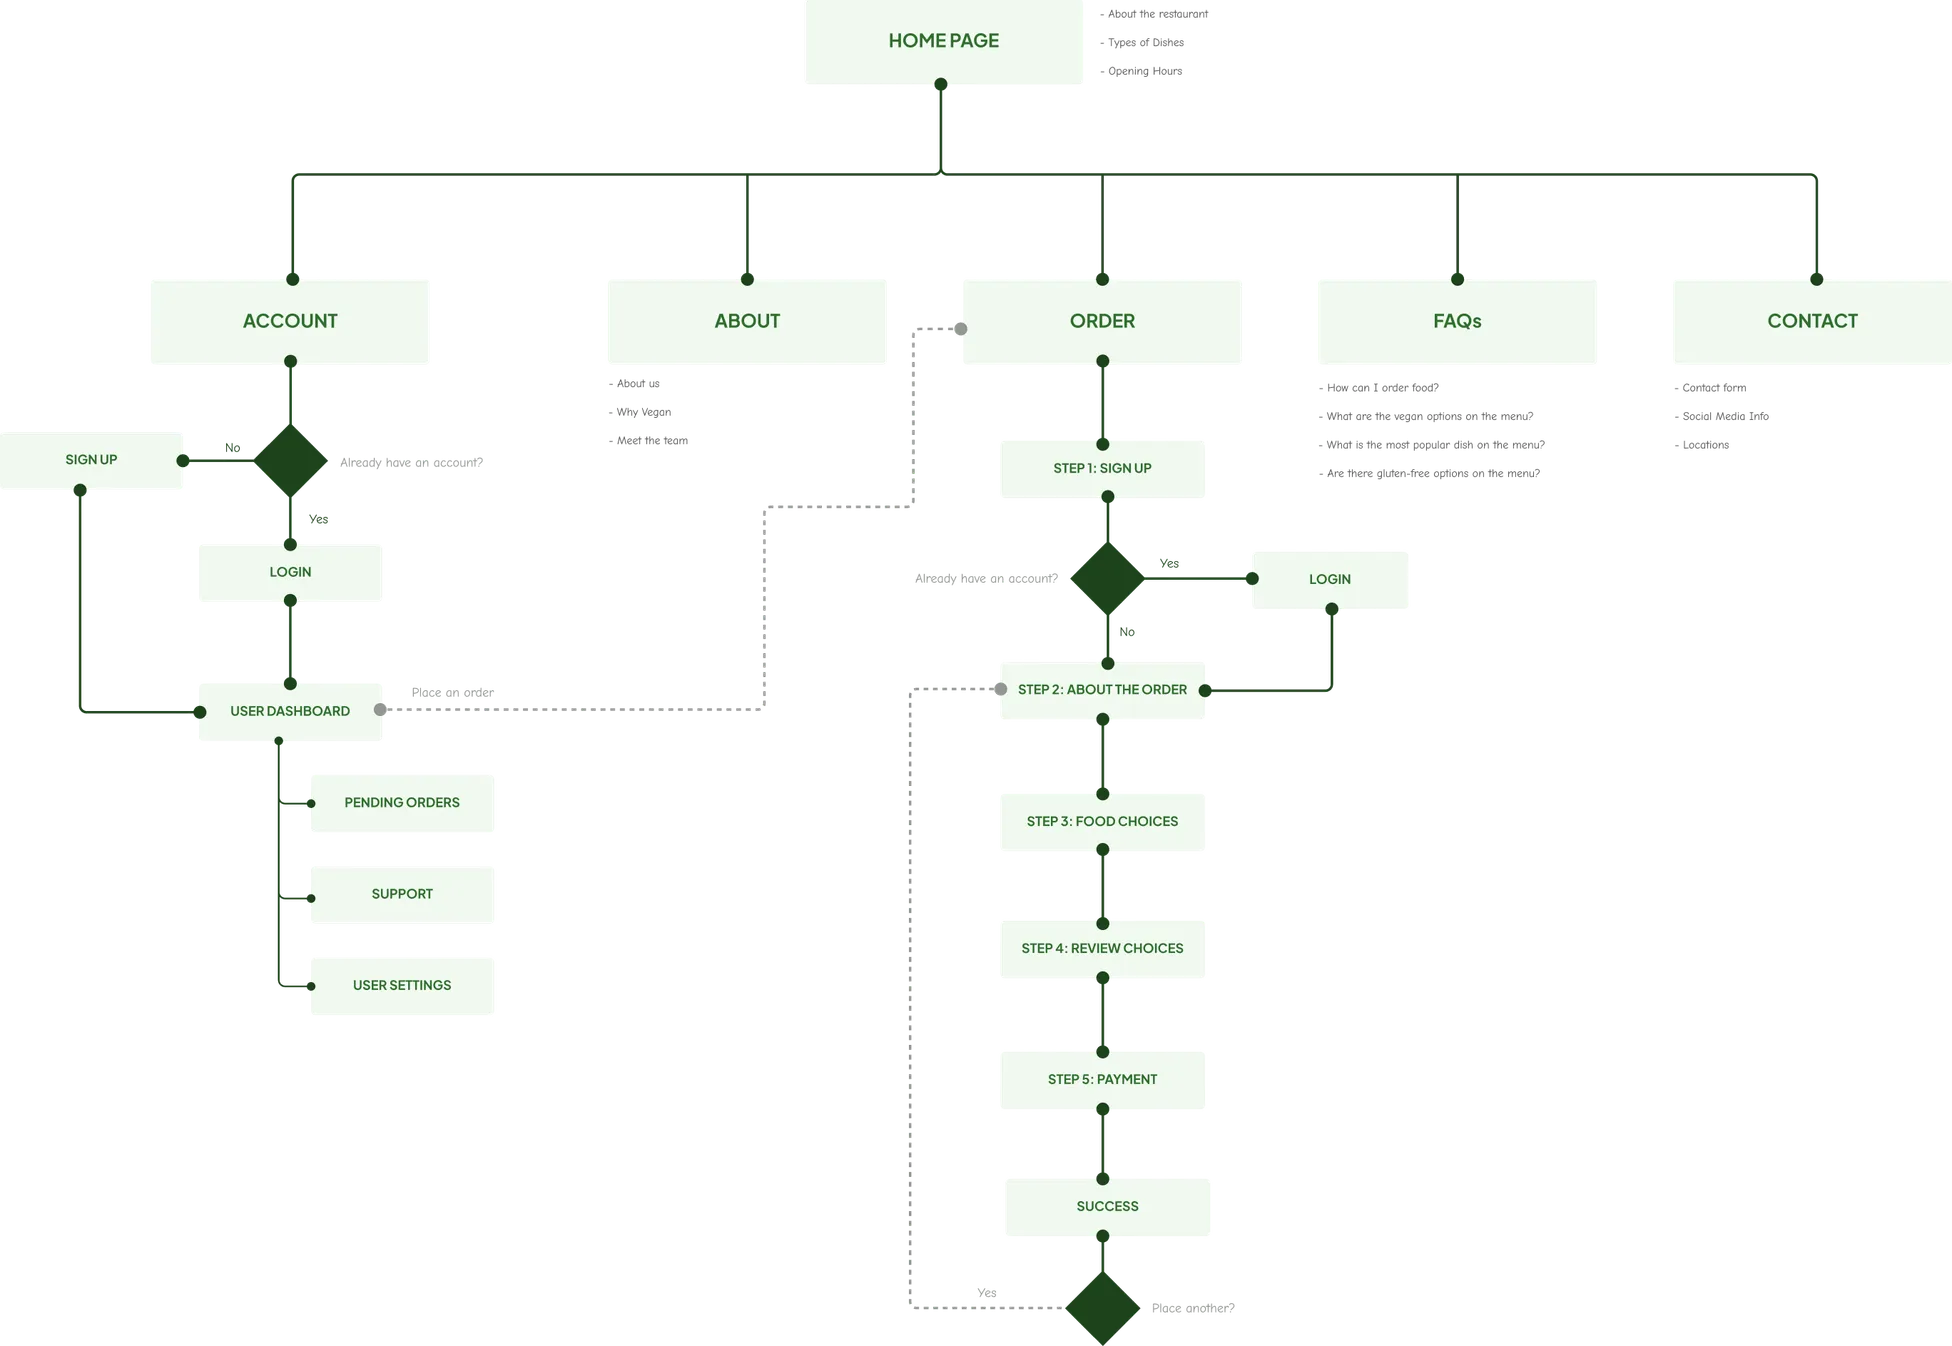
After defining the problems to be solved, the next stage of the project consisted of creating a detailed site map. The site map was crucial in helping to logically organize the structure of the site, ensuring that the user experience is intuitive and efficient. This step was essential to define the navigation flow and user interactions.
After completing the sitemap, the next step involved creating wireframes. Wireframes are detailed sketches that outline the structure and layout of the platform's pages, allowing a concrete visualization of the future user interface. This approach was crucial for defining the layout of elements, navigation and functionalities, ensuring that the design meets user requirements.

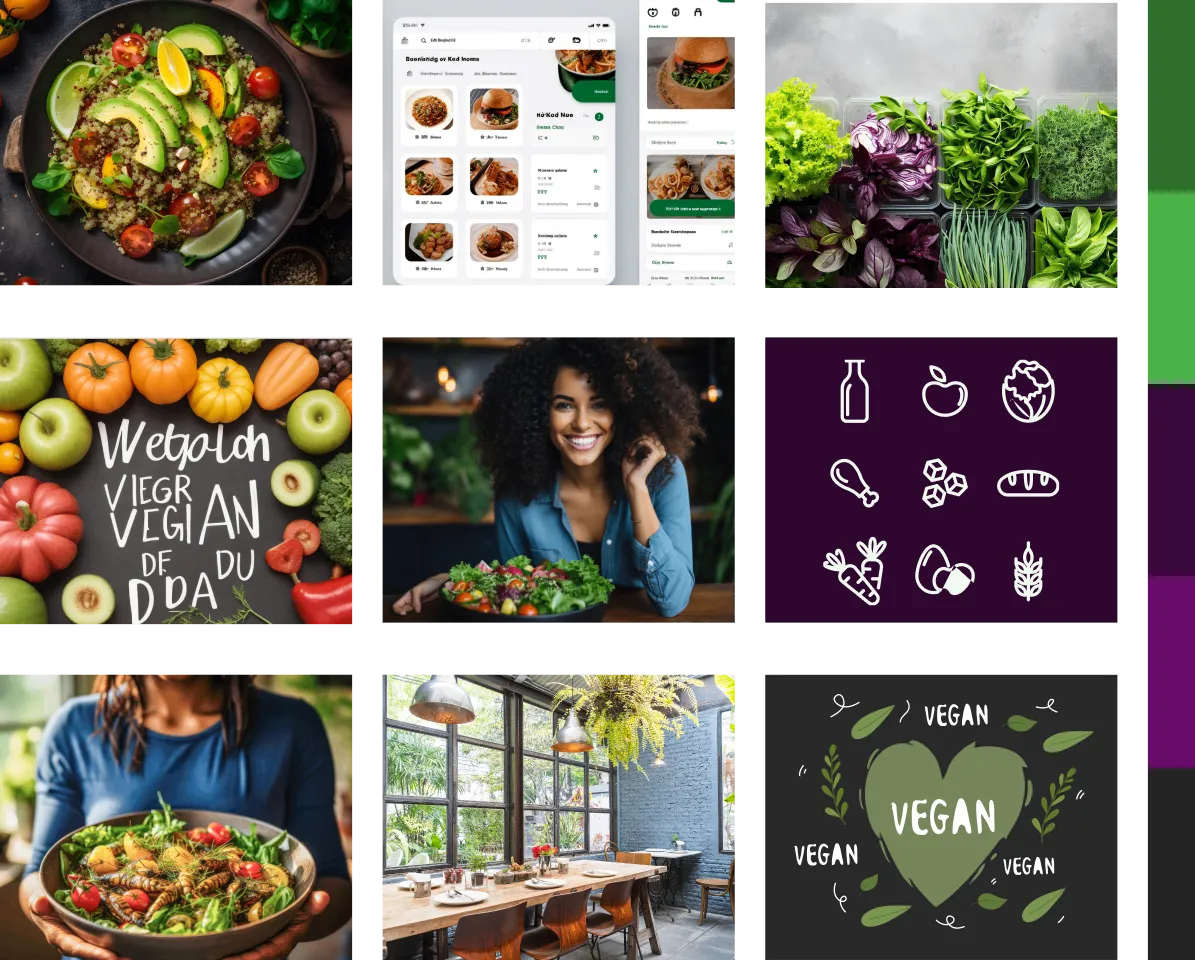
As part of the creative process, I developed a moodboard. This moodboard served as an essential visual tool to explore and communicate the desired aesthetic and visual identity of the project.
Using the context of a vegan restaurant, I tried to highlight the importance of healthy and sustainable food, incorporating the following essential elements:
Shades of deep greens, earth and pastel tones to represent the freshness of the ingredients and the connection with nature.
Images of fresh vegetables, vibrant fruits and other natural elements to convey the authenticity and quality of the ingredients used
Clean, minimalist design to emphasize the purity and simplicity of vegan foods
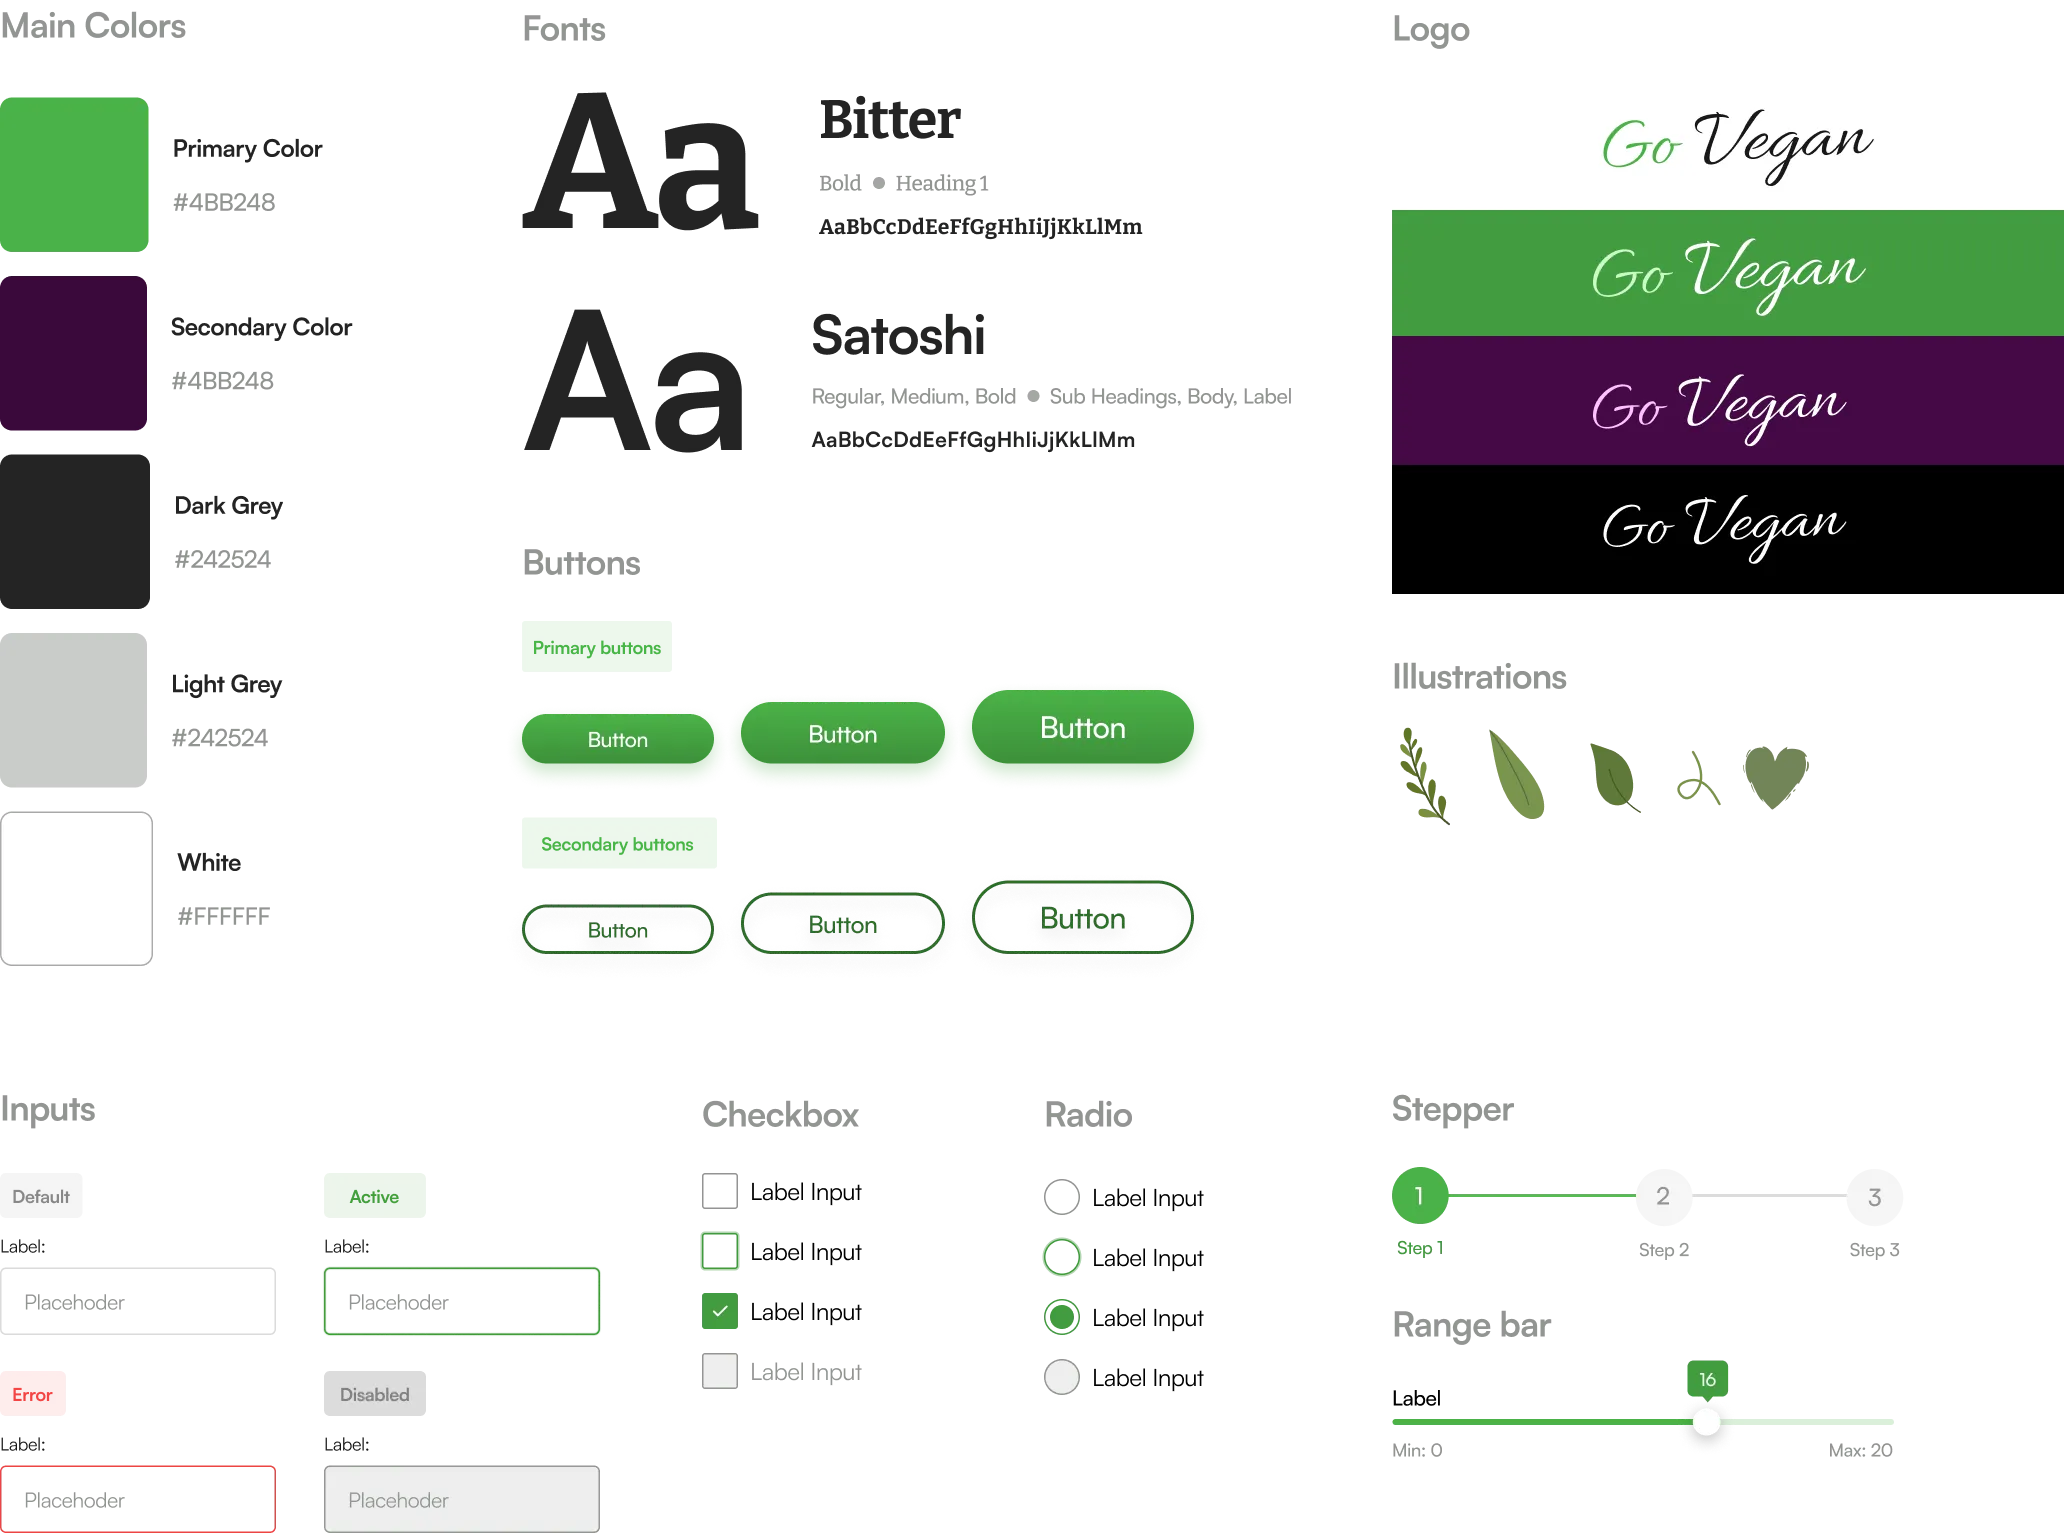
The process step involved the creation of the visual identity. This step consisted of developing the appearance, style and visual elements that would represent GoVegan in a distinct and attractive way. Visual identity is essential for conveying the brand's personality and establishing a visual connection with the target audience, ensuring a coherent and memorable experience for users.
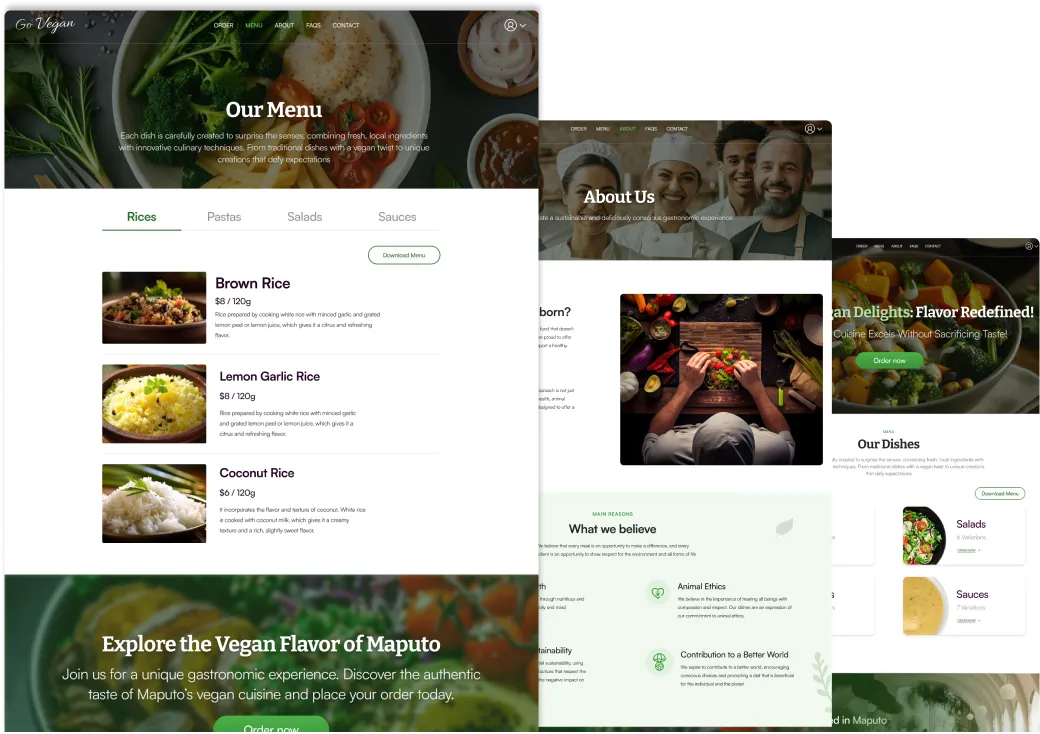
We then moved on to creating high-fidelity prototypes. This phase involved the construction of detailed and interactive visual representations of the user interface (UI), which accurately reproduce the functionalities and final design of the project. High-fidelity prototypes provide a tangible and realistic representation of the experience users will have when interacting with the site, allowing for a more accurate assessment and identification of possible improvements.

Subsequently, I developed the mockups for mobile devices, ensuring that the design was responsive and offered a consistent and optimized experience across different platforms and screen sizes.

Then I created an interactive prototype for real-time user testing, allowing me to evaluate usability and user experience in a practical and iterative way.
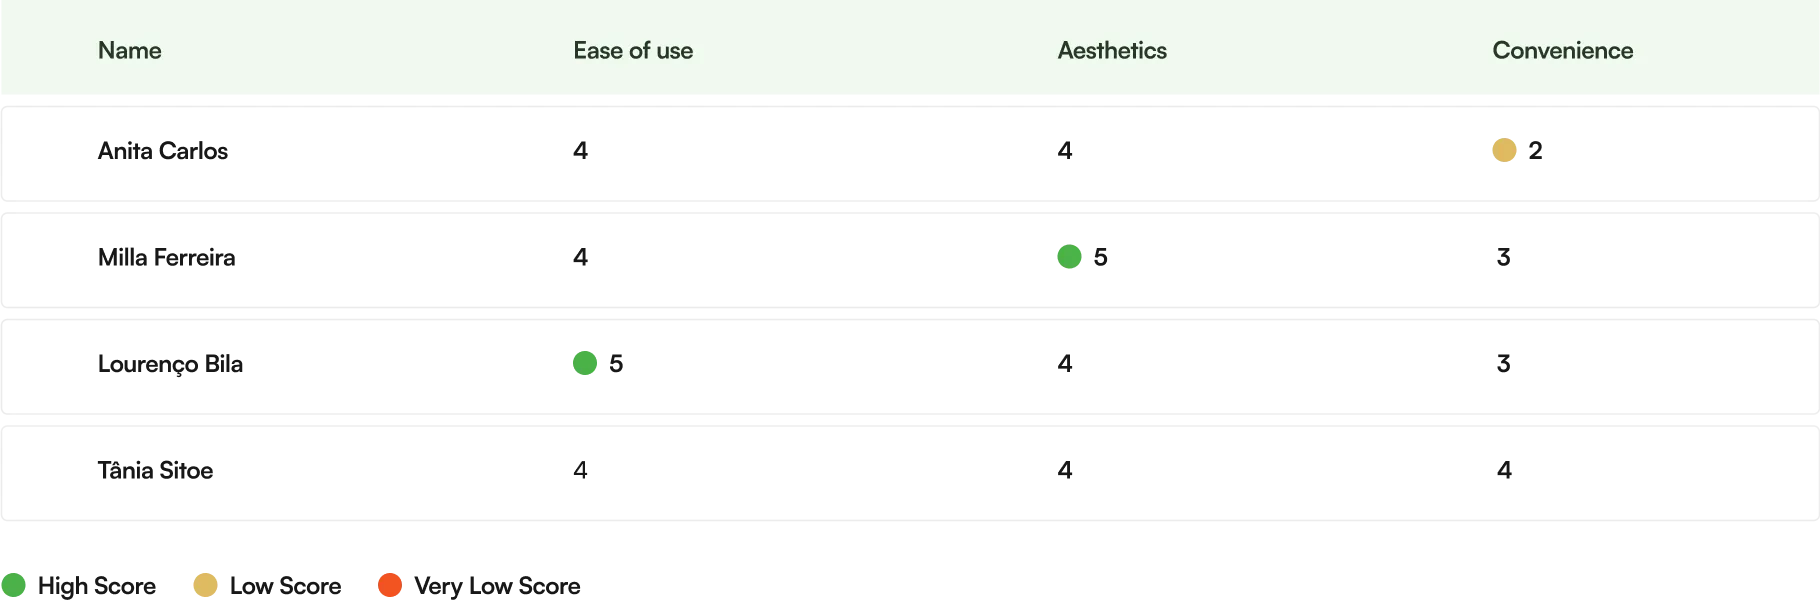
I used the interactive prototypes during the testing phase, allowing users to interact and experience the process of placing food orders on the website. Before testing, I prepared a usability test plan to guide the focus and objectives of testing. I asked the 4 users to provide feedback, assigning ratings from 1 to 5 for the following criteria: ease of use, aesthetics and convenience.
An exploratory study with four people using the interactive prototype, carried out before the React implementation. The ratings describe that sample and that version of the design.
During the testing phase, I noticed that the representation of dish quantities in percentages was not so clear to users. In terms of convenience, they preferred units or grams, as they conveyed a clearer and more direct understanding of the quantities of dishes
I found it a little confusing at first when I saw the quantities expressed as a percentage. I would prefer to see quantities in grams or units as this would give me a clearer understanding of portions
Anita Carlos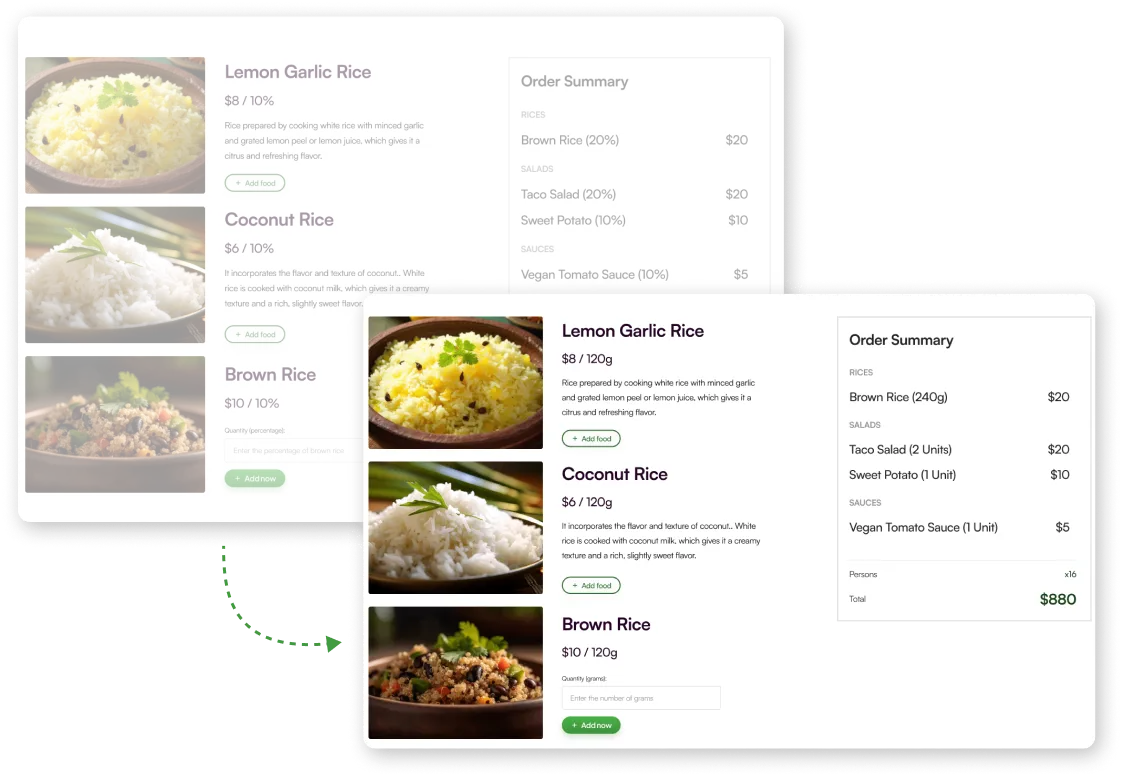

The clearest lesson was to question how quantities were presented. The prototype sessions exposed a problem with percentages; the later frontend expresses portions as explicit units and uses the same data to calculate cart totals.
The outcome is a researched design and a coded frontend demo. The four-person prototype study informed the interaction, while component tests exercise interface behaviour. Evaluating the complete coded flow with users remains a separate step.
Preview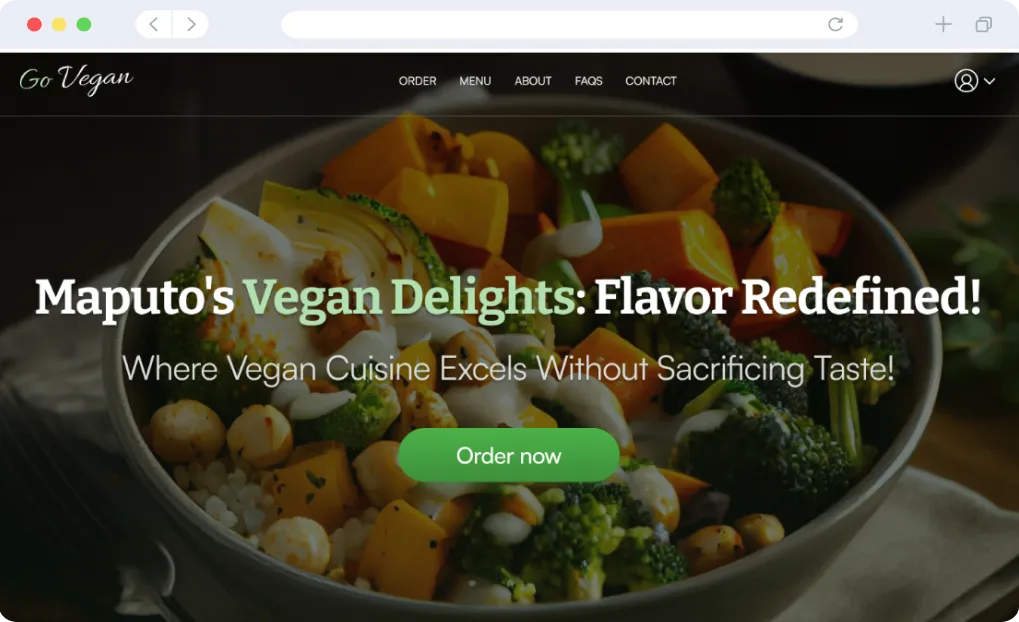


Frontend engineering
React and TypeScript structure the demo around reusable controls, an order flow and shared cart state. The unit of a portion stays explicit from the menu to the total.
UX decision → frontend
Observation
Prototype participants wanted grams or units to understand their portions.
Decision
Each dish has a unit, a base portion and a price, carried into the interface.
Implementation
Each line total uses quantity × price ÷ base portion. Selection, summary and review share the same basket.
Each dish defines its unit, base quantity and price. This makes the display label and the price calculation depend on the same menu data.
Source code: A typed portion model. Opens in a new tab.A Redux Toolkit slice handles adding, updating and removing dishes, calculates each line total and stores delivery details.
Source code: Shared cart state. Opens in a new tab.React Hook Form requires a quantity and checks the minimum portion for that dish. The input label and validation message include the unit.
Source code: Validation close to the input. Opens in a new tab.Vitest and React Testing Library tests exercise field errors, menu prices and units, and simulated account forms. These are separate from the prototype usability sessions.
Source code: Component tests. Opens in a new tab.The basket is kept in memory and resets on reload. Account and payment interactions are simulated in the browser. The project demonstrates the frontend flow rather than a live ordering operation.